> ## Documentation Index
> Fetch the complete documentation index at: https://docs.pezzo.ai/llms.txt
> Use this file to discover all available pages before exploring further.
# Monitoring & Observability
Pezzo enabels you to easily observe your Geneartive AI operations. This includes:
* **Traces and Requests** - Pezzo automatically traces your operations and requests and provides you with a detailed view of the execution of your operations.
* **Advanced Filtering** - Filter your traces and requests by any field, including custom fields (e.g. user ID, correlation ID, etc).
* **Metrics** - Pezzo automatically collects metrics from your LLM calls (execution time, cost, error rate, and more) and provides you with detailed dashboards.
* **Alerts** *(Coming Soon)* - Define alerts on your metrics and get notified when something goes wrong.
Observe your Generative AI operations with Pezzo.
# Requests View
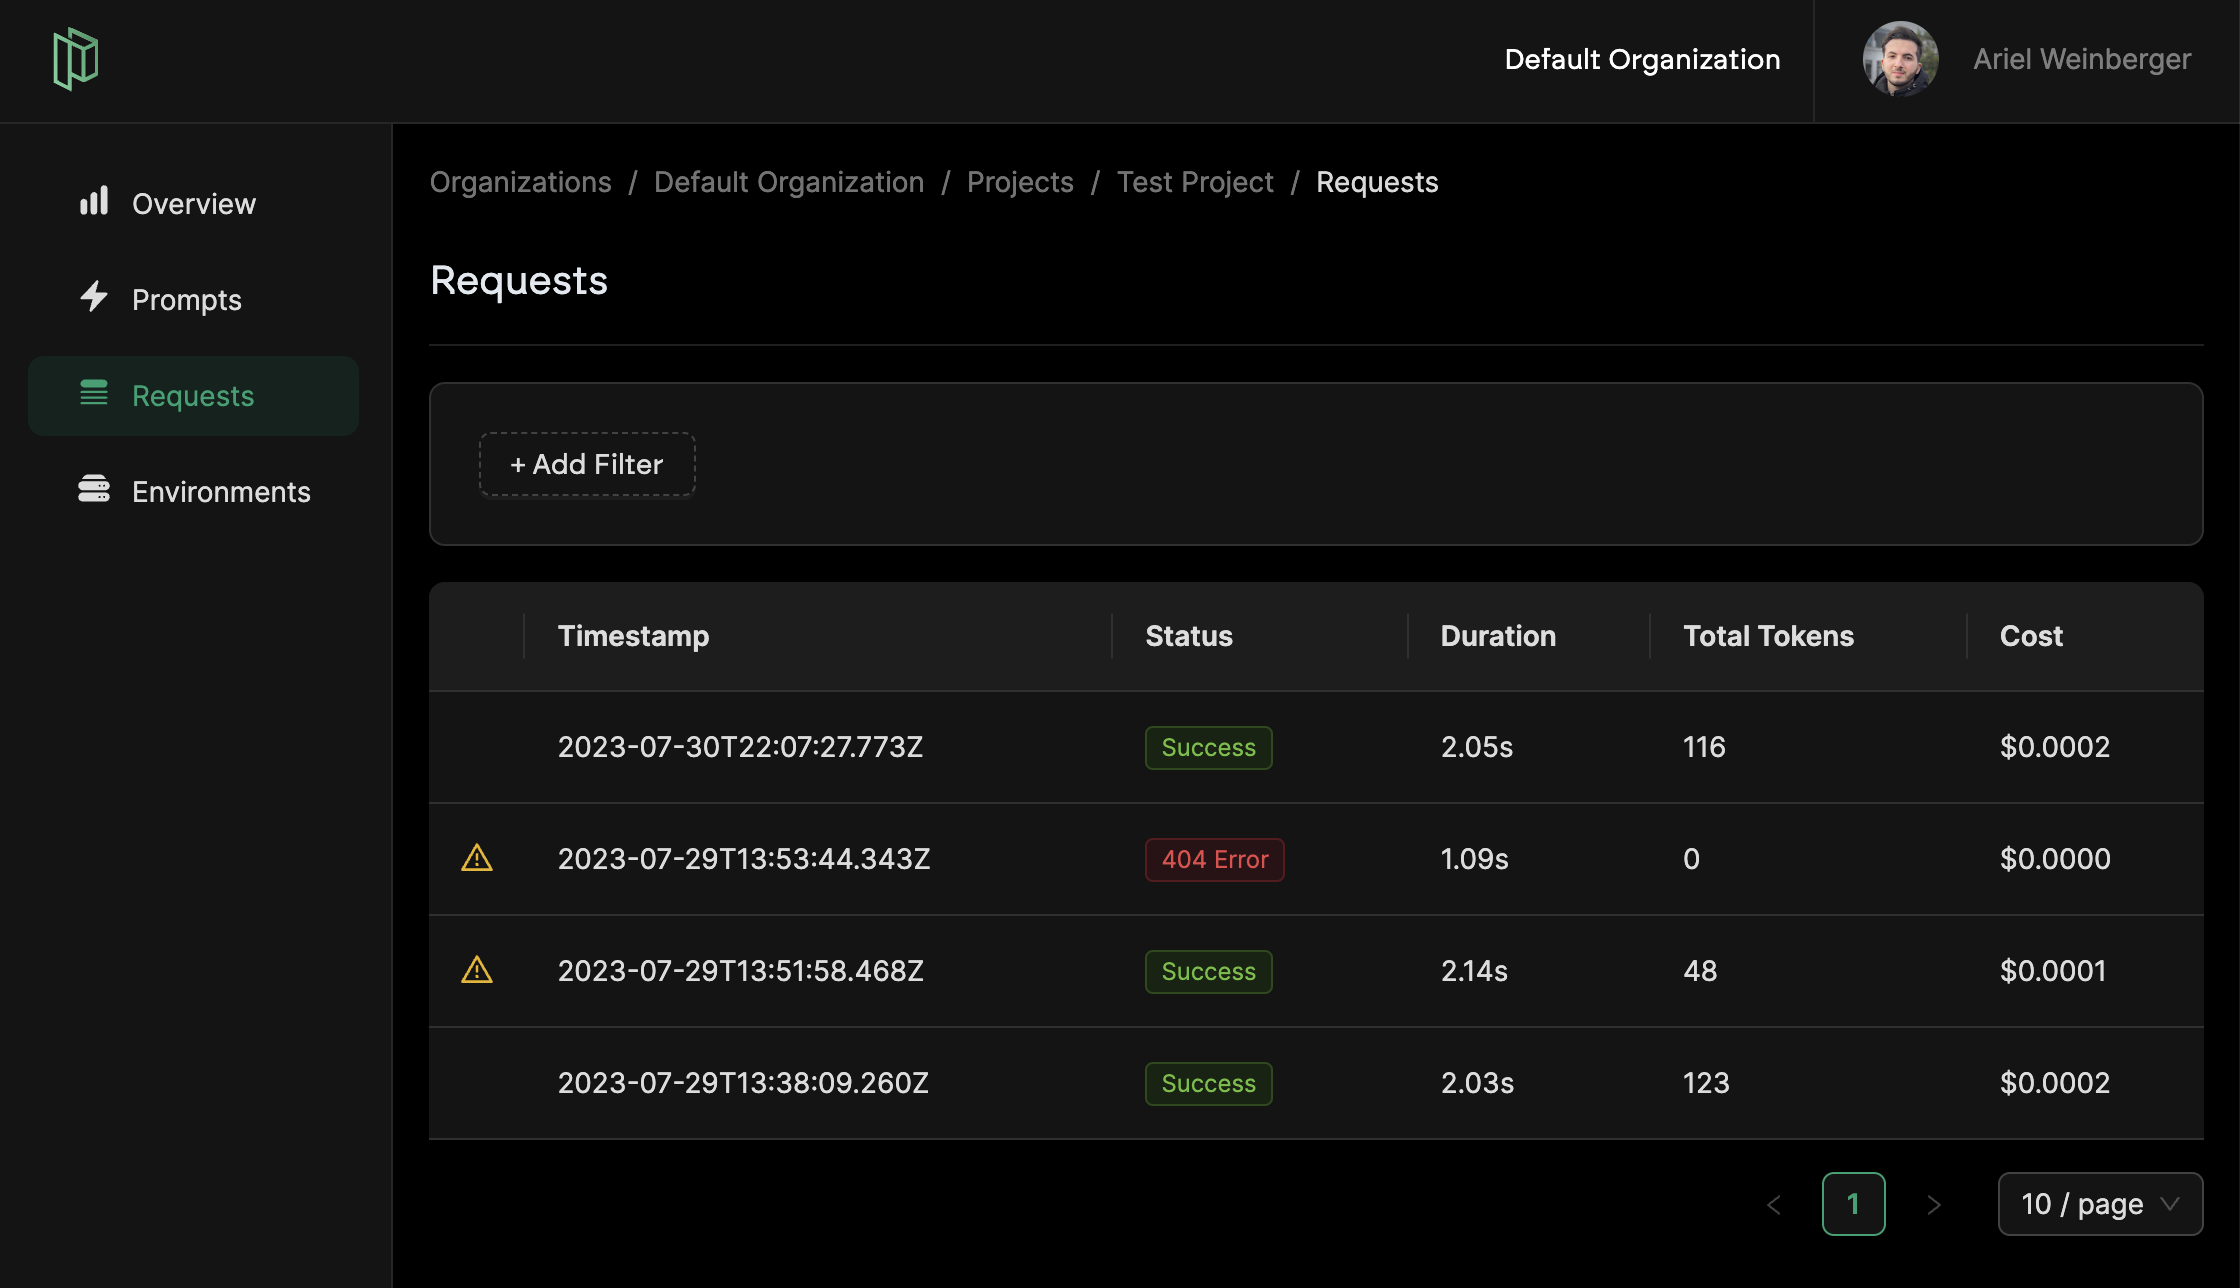
Every project on Pezzo has a dedicated Requests view. This view shows you all the requests that have been made to your project.
 ## Filters
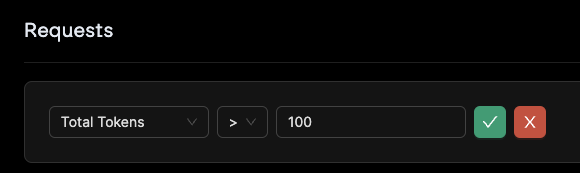
You can filter requests by various criteria. For example, you can filter by the status of the request, by date/time, or by the cost of execution.
## Filters
You can filter requests by various criteria. For example, you can filter by the status of the request, by date/time, or by the cost of execution.
 ## Inspector
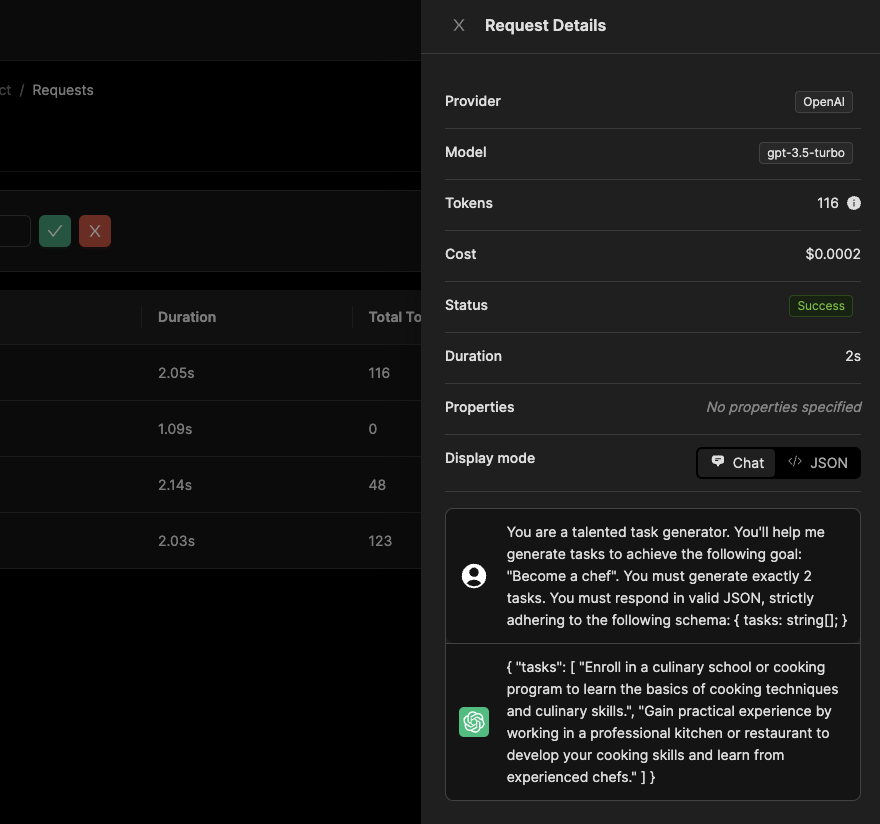
You can inspect the details of any request by clicking on it. This will open the Inspector view.
## Inspector
You can inspect the details of any request by clicking on it. This will open the Inspector view.
 # Prompt Metrics
If you feel that there are metrics that are missing, please let us know by [creating an issue on GitHub](https://github.com/pezzolabs/pezzo/issues).
If you manage your prompts with Pezzo, you are able to view insights and metrics for a specific prompt.
# Prompt Metrics
If you feel that there are metrics that are missing, please let us know by [creating an issue on GitHub](https://github.com/pezzolabs/pezzo/issues).
If you manage your prompts with Pezzo, you are able to view insights and metrics for a specific prompt.
